Data Activity 5 / Unit 7
Task
Find out mean, median and mode of variables sbp, dbp and income. Find out the five-figure summary of income variable and present it using a Boxplot. Run a suitable hypothesis test to see if there is any association between systolic blood pressure and presence and absence of peptic ulcer.
Process and Findings
library(haven)
health_data <- read_sav("path location")
mean(health_data$sbp)
mean(health_data$dbp)
mean(health_data$income)

> mean(health_data$sbp)
[1] 127.7333
> mean(health_data$dbp)
[1] 82.76667
> mean(health_data$income)
[1] 85194.49

#try to do all actions in single command
colMeans(health_data[, c("sbp", "dbp", "income")], na.rm = TRUE)
# this worked but was not necessaryily quicker!
#the comma after the first square bracket indicates to select all rows (data[rows, columns])
¤remove na (na.rm) is used to ensure missing values don't effect result

> colMeans(health_data[, c("sbp", "dbp", "income")], na.rm = TRUE)
        sbp         dbp      income
  127.73333    82.76667 85194.48571

#five figure summary of var "income"
summary(health_data$income)

> summary(health_data$income)
   Min. 1st Qu.  Median    Mean 3rd Qu.    Max.
  52933   68637   86561   85194   99696  117210

boxplot(health_data$income, main="income", col = "blue") # Figure 1

#or using ggplot (outlier not relevelant to this examnple but included for reference).  Figure 2
ggplot(data = health_data, aes(x = "", y = income)) +
  geom_boxplot(fill = "steelblue", outlier.colour = "red", outlier.shape = 16) +
  labs(title = "Income Distribution", x = NULL, y = "Income") +
  theme_minimal() +
  theme(
    plot.title = element_text(hjust = 0.5, size = 16, face = "bold", margin = margin(b = 15)), #center title
    axis.text.x = element_blank(),       # remove x-axis label text
    axis.ticks.x = element_blank())       # remove x-axis ticks


#Run a suitable hypothesis test to see if there is any association between systolic blood pressure and presence and absence of peptic ulcer.
#H0: there is no association between SBP and presence pectic ulcer
#H1: there is an asspcoation between SBP and presence of peptic ulcer

#run t-test
t.test(sbp ~ pepticulcer, data = health_data, var.equal = TRUE)

	Two Sample t-test

data:  sbp by pepticulcer
t = 1.2772, df = 208, p-value = 0.203
alternative hypothesis: true difference in means between group Yes and group No is not equal to 0
95 percent confidence interval:
 -2.420494 11.326830
sample estimates:
mean in group Yes  mean in group No
         131.3171          126.8639
Figure 1
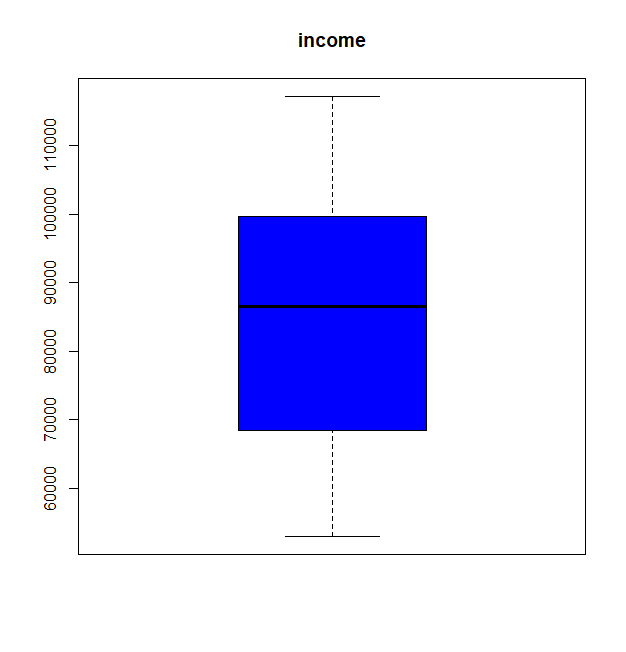
Figure 2

Findings
P value is 0.203, as this value is >0.05 there is not enough evidence to reject H0, therefore there is not evidence to show an association between SBP and peptic ulcer.
```