Data Activity 9 / Unit 11
Task
Using the Health_Data, please perform the following functions in R:
Perform simple linear regression analysis to find the population regression equation to predict the diastolic BP by systolic BP. Interpret the findings of regression analysis at 5% level of significance.
Process and Findings
library(haven)
library(ggplot2)
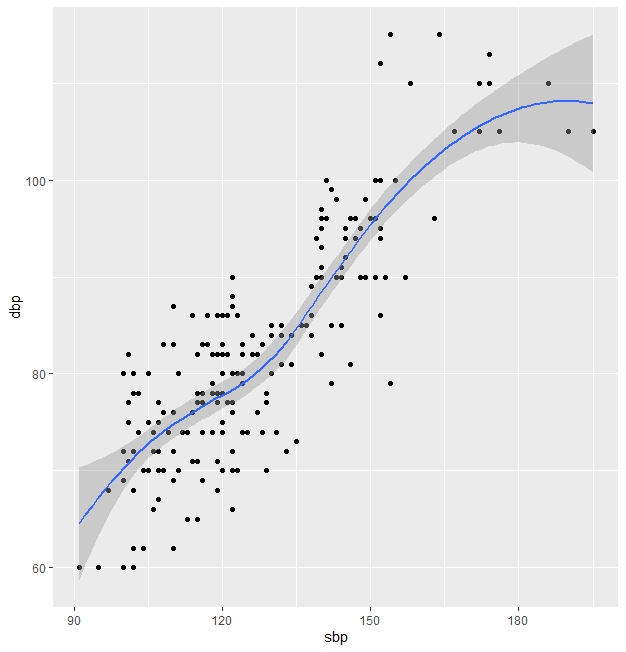
#sart with a scatter plot to review the data: figure 1.
ggplot(health_data, aes(x=sbp, y=dbp))+
geom_point()+
stat_smooth()
# there seems to be a linear relationship
#calculate correlation coefficient
cor(health_data$dbp, health_data$sbp)
[1] 0.846808
#correlation coefficient is 0.85, therefore there is a strong relationship
#linear model
model <-lm(dbp~sbp, data = health_data)
> model
Call:
lm(formula = dbp ~ sbp, data = health_data)
Coefficients:
(Intercept) sbp
19.407 0.496
#therefore the population regression equation is "dbp = 19.407 + 0.496*(sbp)
#create summary stats
summary(model)
Call:
lm(formula = dbp ~ sbp, data = health_data)
Residuals:
Min 1Q Median 3Q Max
-16.7958 -3.9366 0.1804 3.6685 19.2042
Coefficients:
Estimate Std. Error t value Pr(>|t|)
(Intercept) 19.4068 2.7931 6.948 4.67e-11 ***
sbp 0.4960 0.0216 22.961 < 2e-16 ***
---
Signif. codes: 0 ‘***’ 0.001 ‘**’ 0.01 ‘*’ 0.05 ‘.’ 0.1 ‘ ’ 1
Residual standard error: 6.264 on 208 degrees of freedom
Multiple R-squared: 0.7171, Adjusted R-squared: 0.7157
F-statistic: 527.2 on 1 and 208 DF, p-value: < 2.2e-16
#interpretation is that both the intercept and the predictor variable (sbp) are highly significant
#therefore we can reject H0 and accept H1.
#there is a highly significant relationship between SBP and DBP
Findings and Learnings
The interpretation is that both the intercept and the predictor variable (sbp) are highly significant.
The p value is <2.2e-16.
Therefore we can reject H0 and accept H1.
There is a highly significant relationship between SBP and DBP.
Figure 1