Data Activity 8 / Unit 10
Task
Using the Health_Data, please perform the following functions in R:
Find out correlation between systolic and diastolic BP. Produce a scatter plot between systolic and diastolic BP.
Process and Findings
#Find out correlation between systolic and diastolic BP.
#step one, check normality using Andersson-Darling test
library(nortest)
ad.test(health_data$sbp)
ad.test(health_data$dbp)
Anderson-Darling normality test
data: health_data$sbp
A = 2.4472, p-value = 3.319e-06
> ad.test(health_data$dbp)
Anderson-Darling normality test
data: health_data$dbp
A = 1.8085, p-value = 0.0001226
#P-value for both is <0.05 which suggests that the data is NOT normally distributed
#therefore need a non-parametic correlatyion test. e.g. Spearman's rank correlation
cor.test(health_data$sbp, health_data$dbp, method = "spearman")
Spearman's rank correlation rho
data: health_data$sbp and health_data$dbp
S = 305884, p-value < 2.2e-16
alternative hypothesis: true rho is not equal to 0
sample estimates:
rho
0.8018198
# P-value <2.2e-16 which is < 0.05, therefore the test is statistically significant and we reject H0 and coclude there is a correltation between sbp and dbp
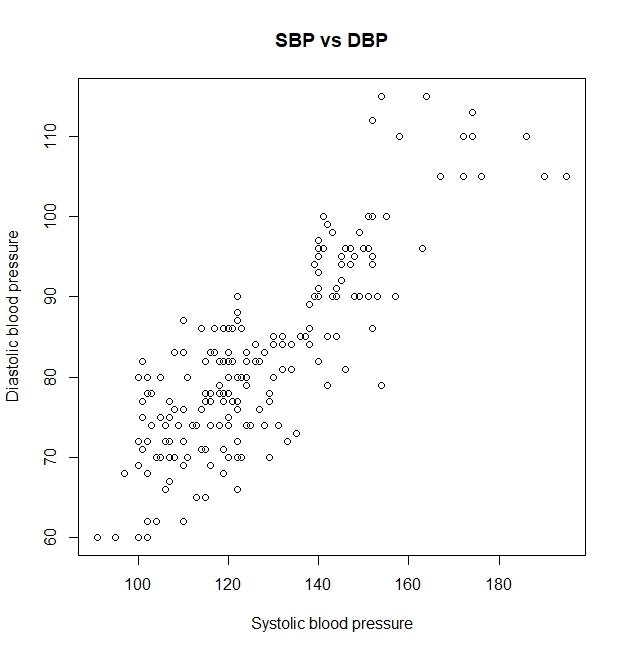
#produce a scatterplot - figure 1
plot(health_data$sbp, health_data$dbp)
#adding axis labels and title
plot(health_data$sbp, health_data$dbp,
xlab = "Systolic blood pressure",
ylab = "Diastolic blood pressure",
main = "SBP vs DBP")
Figure 1